Solidify Your Virtual Event ROI: 15 Effective Metrics and KPIs For Your Next Event
Maximize Your Marketing ROI
Join 10,000 other marketers already getting the best tips on running engaging events that boost pipeline and create raving fans.
There's a reason investment in virtual event platforms like Goldcast has grown almost 70% since the pandemic—virtual events are a critical part of the event landscape now.
At the same time, we know that there's no industry-wide standard when it comes to metrics and benchmarking, which continue to be a challenge for event marketers who need to track and measure their success.
Today, we'll talk about why tracking metrics and key performance indicators (KPIs) is essential when it comes to gauging how your virtual events are doing and maximizing ROI. You'll learn about 15 great metrics to track and what they mean, and how the Goldcast ROI Dashboard can help you in your marketing efforts!
Read on to learn:
- Why does virtual event success matter?
- Measuring virtual event success: Goals, metrics, and KPIs
- Let's get it started: Pre-event metrics to track
- Virtual event metrics to track during your event
- Post-event metrics to track
- Goldcast's Event ROI Dashboard makes tracking a breeze
Why does virtual event success matter?
Sure, events are fun—but that reasoning won't hold up when justifying your budget spend to senior leadership! Tracking ROI helps event marketers prove their event-attributed pipeline and revenue to leadership and builds an undeniable case for what we already know: Events are necessary for driving business.
By tracking your success, your entire team also gets better at every piece of the process. Your marketin and sales teams begin to flow better together, your sales team always has the info they need to go after the warmest leads, and your marketing strategy sharpens over time because it's based on real data and results.
Finally, you can compare data from different types of events side by side to see what type of event provides the biggest bang for your buck (and time). For example, if your company does a mix of virtual, in-person, and hybrid events, you can see how they stack up against each other. If one consistently outperforms the other, you may want to shift your focus for a higher ROI.
📈Let’s Go-al! 14 Examples of Event Goals and Objectives for Your Next Virtual Event
Measuring virtual event success: Goals, metrics, and virtual event KPIs
If you're looking to gain insight into how your online events are performing and want to be able to make informed decisions about future events, having a tangible way to track metrics is key.
However, before you can start measuring success, you have to know what it looks like. For some companies, that might mean more registrations. For others, it might be higher attendance rates or more qualified leads. And for still others, it could be a higher conversion rate (the dream!).
Once you know your goals, you can hone in on the metrics and KPIs that will help you track progress toward that specific benchmark. For example, if you're looking for a boost in brand awareness, you may choose to focus on the number of website visits during your event campaign and directly after.
Your metrics could include a myriad of options like:
- Number of registrations
- Number of attendees
- Hashtag reach on social media platforms
- Engagement levels during the event
- Conversion rate after the event ends
- Pipeline and/or revenue influenced
Having a meaningful goal ensures that when you look at these numbers, you know how each KPI affects your specific goal. You can draw conclusions from it in order to iterate in the future and improve.
We'll talk about this more soon, but having a virtual event dashboard can really come in handy here! A dashboard keeps all of your info readily available and stored in a central location, so you can access it whenever you need. No more sifting through long reports or dealing with large amounts of unwieldy data to get what you're looking for!

Let's get it started: Pre-event metrics to track
Ideally, you'll be tracking metrics at every stage, from before you hit the event stage to after the curtains close. That way, you get a true picture of how your event did overall.
Here are a few of our favorite pre-event metrics to keep an eye on!
Total registrations
This one's pretty straightforward: How many people have signed up for your event? The more people that are sending you their information, the greater the chance this event will be a popular one! However, it's worth noting that quantity isn't necessarily better than quality, which leads us to our next metric.
Target account registrations
You should know who your target audience is. These are your highest quality registrants because they're the most likely to become loyal customers! At this stage, look to see if your event is attracting registrations from the accounts you were hoping to get signed up. The higher the percentage of target accounts you're drawing, the better. ✅Pro Tip: Use the Registration Details section of your Goldcast Analytics dashboard to track target account registrations pre-event.
Registration by source (UTM)
UTM codes are a simple way for you to know how people found your event. For example, you can add a UTM code to your LinkedIn promotional posts. Once people sign up, you'll be able to see that they came from LinkedIn or from other platforms. This information can help you decide where to invest future funds or, in other cases, dial back on certain channels.
Cost per registration
You may want to examine how much each sign up costs you. If you're running a social media ad campaign and you drive two signups from it, the cost per registration would be: (Total cost of ad campaign) / (# of signups). So, if your social media campaign cost $250, each registration ran you $125. From there, you can decide whether the spend on certain channels makes sense for the number of sign-ups it garners you.
🤩Speaking of ROI: Check out our Event ROI Calculator to calculate the revenue impact of your digital events.
Virtual event metrics to track during your event
You're almost ready to pull back the curtain and start the main event! Here are a handful of metrics that you might keep an eye on during your session.
Attendance
You already know how many people signed up, but how many people actually showed up? While a lower than expected attendance rate may not necessarily be cause for alarm (many people watch the on-demand recording afterward), if you're seeing a lot less people than you expected, it might be time to investigate.
Over time, you can use your registration and attendee numbers to build your own benchmarks. This will help you set goals and give you insight into what success truly looks like for your own digital events.

Attendee engagement
We always say that audience engagement is king, which is why we've built the Goldcast platform around encouraging folks to participate! Pay attention to your overall engagement scores during the event.
You could even use overall event engagement as a metric to adjust mid-session. For example, if you see that no one's engaging with any links, resources, in-app games, or asking questions, perhaps it's time to roll out a poll.
Poll responses
Speaking of live polls! Keeping an eye on how many people are responding is a good engagement metric and an easy way to foster more participation. Share the results after the poll so that people can see where they're at in relation to others and spark new dialogue among audience members.
Chat messages
We love to see attendees using the chat option to share their insights, ask questions, and respond to others. If the chat seems less lively than you'd like, you can have the host or presenter ask a targeted question and nudge folks to use the chat to share their responses.
✅Pro Tip: It’s a good idea to have an employee act as the chat moderator to ensure the conversation continues to flow across the entire event.
Retention
How long did people stay for your event? How long did they stay engaged? These numbers are important to know for future events; if you notice that people consistently drop off around the 35-minute mark, you'd want to be sure to pack in your relevant content before that time during future events.
Post-event metrics to track
Now it's time to collect the final pieces of the puzzle and uncover a holistic view of how your event performed.
Session popularity
The event is over, so now you can take a look at how it stacks up against other past events. Did it have the most registrations you've ever seen? Did a staggeringly high number of people engage during the event, whether it was asking questions or interacting with polls? A very popular session may offer some clues into how to create successful future events!
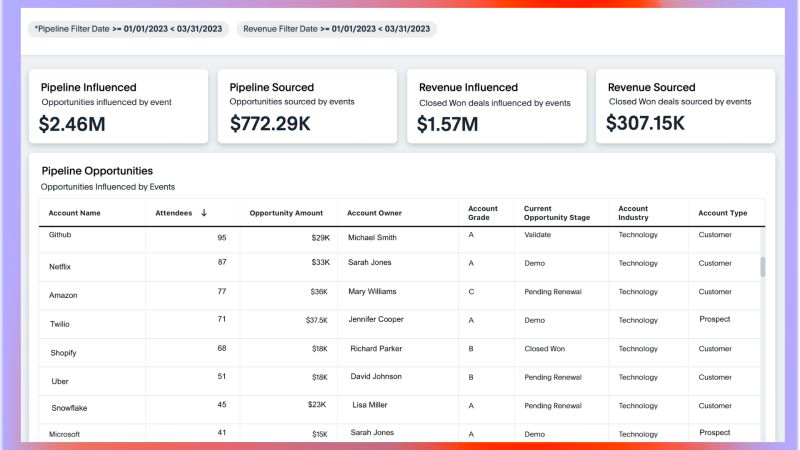
Pipeline sourced
When a person signs up for your event and later becomes a sales lead, that contact becomes a source of pipeline for your company, attributable to your event. For bottomon of the funnel content, pipeline sourced is a great KPI to measure event success by. This is just one of many valuable metrics you can find in the Goldcast Event ROI Dashboard!
Pipeline influenced
This can help you get an idea of the effect your event had on the total sales pipeline. This KPI measures the total pipeline your events influence through attendance of leads and contacts from your accounts which have an opportunity created and in an open state within the selected pipeline filter date range.
Revenue sourced
This metric refers to the total number of opportunities which were sourced by a specific event and also "closed-won" during a specific date range. Keeping it confined to a certain date means you can more accurately point to the event as the source of revenue.
Revenue influenced
If you're a Goldcast member, you've probably already seen this one in our ROI Dashboard. Revenue influenced refers to the total amount of opportunities that were influenced by an event and were also "closed-won" during a certain time period. This is a great overall indicator of event success.
On-demand views
After your event ends, you should create an on-demand recording for your evergreen library and email the link out to everyone who signed up. Tracking how many times this content is viewed can be a good indicator of how valuable your content is and continues to be over time.
Presenting virtual event metrics to senior leadership
As event organizers, there will likely come a time you need to discuss how your events are doing with your leadership team. This may seem daunting, but don't fret! By keeping tabs on how each of the pre-event, during-event, and post-event metrics we've listed here are doing, you're in a great position.
Use the metrics to create a story that walks leaders through exactly how events attract people and bring them into your brand community. Show them examples of how certain events have led to conversions down the road. Highlight examples of how you use certain metrics to make decisions around future events.
Be prepared to explain what these metrics are and how they relate to each other. While this may be our day-to-day, a lot of these KPIs can sound like a new language to someone who doesn't work in B2B marketing!
Goldcast's Event ROI Dashboard makes tracking a breeze
With so many metrics out there, you can see how tracking and presenting all of this information would be no simple feat—until now!
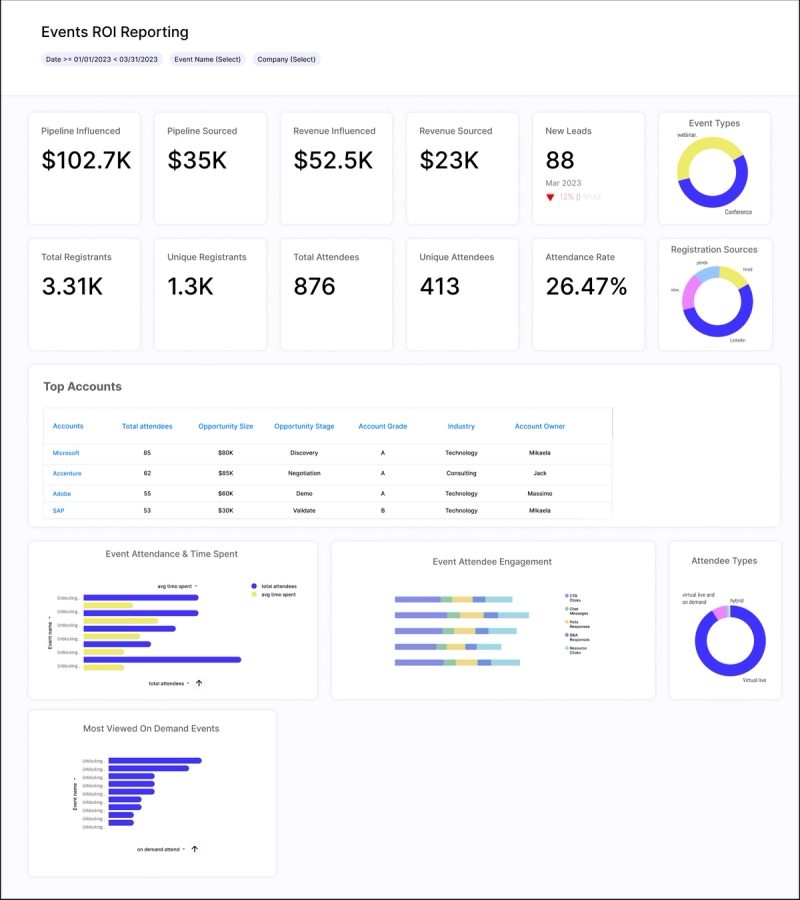
We recently rolled out our new ROI Event Dashboard, which gives you a look at how individual events performed—and how all of your events compare to each other over time.

Note: While you can build a tracking platform yourself, this comes with a lot of challenges! For one, you'll need a CRM expert to build and maintain it. You'll spend a lot of time combining data from different sources and jumping around between platforms. Not to mention, there's a chance for data quality issues if you're manually inputting any of the data.
With our dashboard, you can easily track all of your desired metrics and KPIs in one place. You'll have a cohesive, clear way to present your event results to senior leadership and continue to justify the case for event budget spend.
The best part? Like we talked about earlier, everything on your team gets better when you use metrics to guide your way! You'll be able to show your sales team the impact they're having during follow-up. You can talk to your event team about what worked exceptionally well in a past event. In short, you can keep everyone in the loop on the things that matter most for their specific roles.


Transform Your Video Marketing with AI
Stay In Touch
Platform
Resources
© 2025 Copyright Goldcast, Inc. All rights reserved.


 Upcoming Events
 Event Series
 On-Demand Events

