Prove Event ROI With Goldcast (+5 Metrics CMOs *Really* Care About)

Table of Contents
Maximize Your Marketing ROI
Join 10,000 other marketers already getting the best tips on running engaging events that boost pipeline and create raving fans.
Imagine this: Your C-suite leader calls a meeting with you in one week. They ask you to come prepared with data that illustrates your event ROI.
Are you….
A) ready to go!
B) immediately calling up your marketing ops friends for help
C) panicking because you don't know what to do
D) …wait—you can track event ROI?!
Understanding how your events contribute to your company's bottom line is super important, both for you and senior leadership. But if you're more of a C) or D) answer at the moment, you're not alone, and we're about to show you the light. And, if you're a solid B) person, we can show you how it's possible to pull and analyze that info, all on your own!
For our three-part Event ROI Bootcamp series, Goldcast Head of Marketing, Kelly Cheng, and Director of Product Management, Ilyas Khawaja, demoed how our new Event ROI Dashboard provides all the info you need, right at your fingertips. Today we'll run through five metrics CMOs *really* care about, some info about our amazing new dashboard, and a few FAQs from the session.
Rather watch than read? Catch the full recording below! ⤵️
✨ Psst: You can also access all of our Event ROI Bootcamp sessions on-demand now!
5 key metrics that CMOs want to see
We've interviewed a lot of marketing leaders, and we always make sure to ask them what metrics they care about. Here are the top five we see, time and again:
- Total number of registrations: This one matters a lot to senior leaders. They want to know that there's a solid amount of interest out there and tons of people are signing up to attend your event.
- Total number of attendees: From the first metric, how many of those actually showed up? We've also seen that many leaders are now factoring in on-demand views, in addition to total number of attendees, which is smart. Sometimes, people sign up for an event and then watch it on demand because they can't attend live.
- Top attended accounts: Getting one person from each target account to sign up is great, but it's even better if you can saturate your event with multiple people from each target account. Your company might even set goals to bring in a certain percentage from each target account.
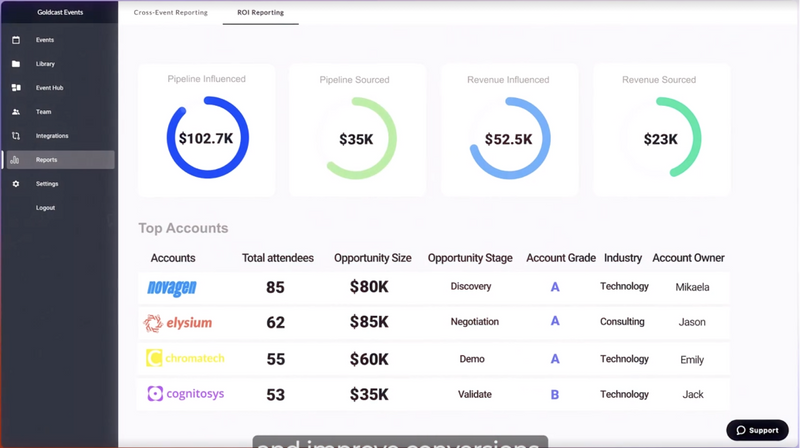
- Sourced pipeline/revenue: We define this as an instance where someone attends your event, and then an opportunity is created after that, meaning the pipeline or revenue was sourced as a result of the event.
- Influenced pipeline/revenue: For influenced pipeline and revenue, we look at whether this event influenced any part of the buying journey. The opportunity was not created after attending the event, but their journey is still shaped by the event they signed up for.
As you start pulling reports, knowing what CMOs prioritize can help you see things from their perspective. It also lets you know where there are opportunities for education; for example, if your CMO is hyperfocused on total number of registrations, you might want to talk them through why you're focusing on the quality of attendees vs total registrants.
💡Learn More: 15 Effective Metrics and KPIs For Your Next Event
Goldcast's Event ROI Dashboard unlocks this info for you!
For many marketers, finding pipeline and revenue data is a challenge. Maybe you don't have the Salesforce login you need, and that's why you're relying on your marketing team to pull it for you. Or perhaps you don't have the necessary training to use your CRM system effectively.
Enter: the Goldcast Event ROI Dashboard, which allows B2B marketers to directly measure the revenue and pipeline impact of their events! Our dashboard seamlessly integrates with Salesforce and provides real-time reporting you can trust.
This level of analytics goes beyond anything I've seen in an events platform." - Brendon Ritz, Senior Director of Marketing Operations at ThoughtSpot
Here are some key features of the dashboard:
- Discover attendance, engagement, revenue, and pipeline metrics at a glance
- Compare all of your events against each other to find your high performers
- Identify highly engaged accounts for each event and pass that info to your sales team
- Drill down into each data point for more information
- Intuitive, attractive reports that are easy to screenshot and share
- Filters to refine your search by date, exclude internal or external company attendees, and more
Easily access pipeline and revenue metrics
Historically, being able to pinpoint your sourced and influenced pipeline/revenue was very challenging. Whether it was because you didn't have access to the system with that data or reports weren't built to capture it, B2B marketers often found themselves struggling to draw a strong conclusion from attendance metrics alone.
That's why, when we created the Event ROI Dashboard, we made sure that it included these pipeline and revenue metrics.
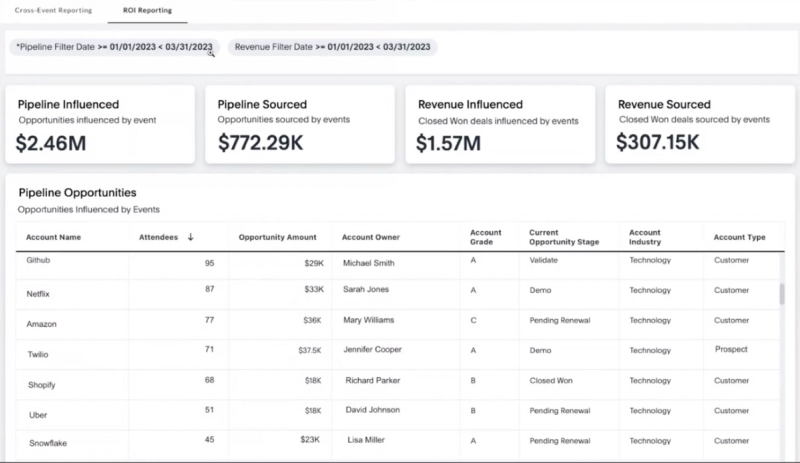
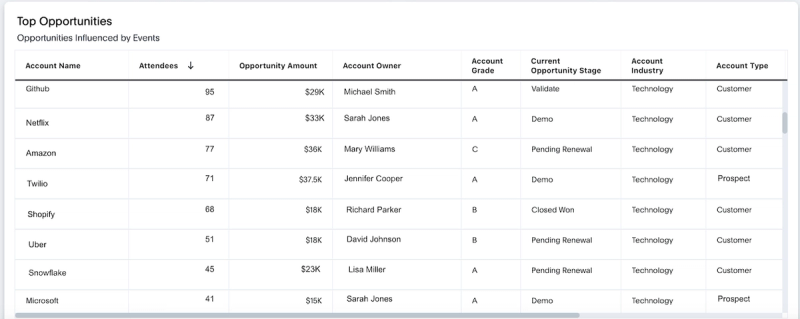
You can see here that the dashboard answers so many questions: How much revenue did this event generate? Which accounts did the revenue come from? What was the pipeline sourced from this specific event? Are there any Closed/Lost accounts that sales should follow up with in the future?
How we create dashboards and event attribution
Let's walk through some screenshots taken from a live Goldcast dashboard, made possible by Align.ly Attribution, a product that you can enable within Salesforce to provide multi-touch attribution insights and full-funnel conversion metrics.
What you see in this dashboard is real, anonymized information. This report covers an event we ran in April; it lasted four days and had nine separate sessions. You can see that we had 435 unique registrations, and a total attendance rate of 369.
This report also allows us to see how many people registered each week. This info is useful because we can compare it against the marketing campaigns we launched and decide whether they were effective, and then apply that information for future event campaigns. (Note: Be sure to use UTM links for accurate tracking of your referral sources!)
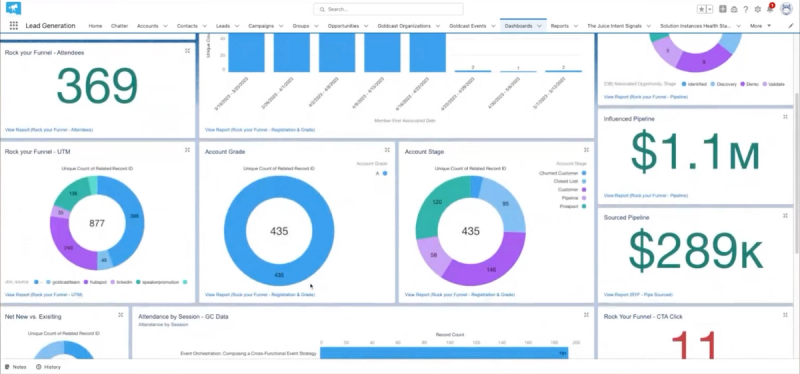
The report is filtered by accounts marked as "Grade A." We use a grading system—A, B, C, F, and unknown—in which A's are the accounts that are highly qualified. That helps us focus our efforts and pare down the information we share with sales for follow-ups.
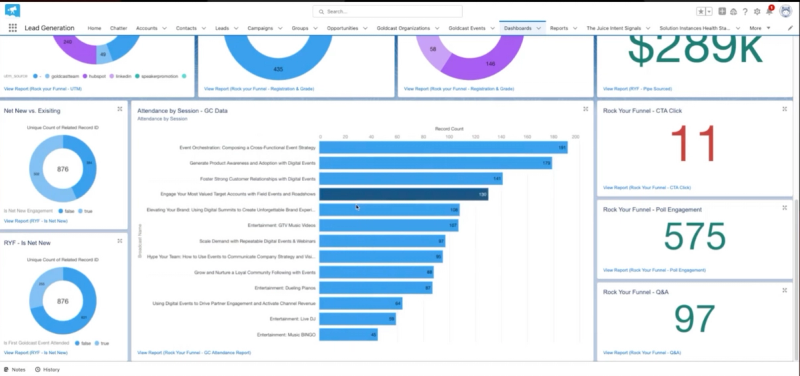
Another awesome feature? Being able to see how many people engaged in high-intent ways. These are your folks who clicked on CTAs, requested demos, and otherwise expressed interest. You can drill down more on this info within Salesforce and then pass that on to your sales team so they know who to follow up with ASAP!
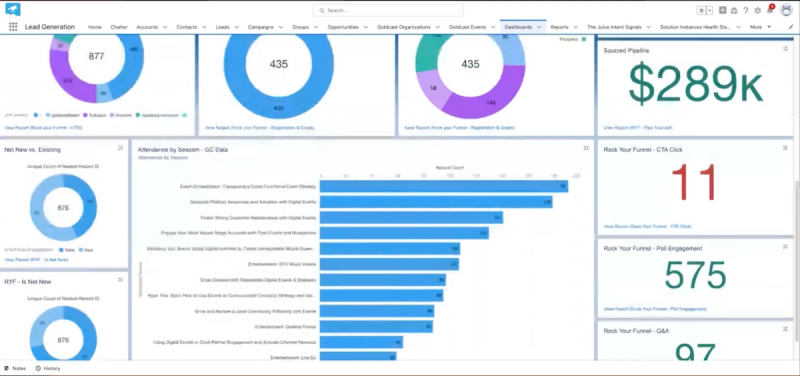
We have a number of opportunity stages at Goldcast: Discovery -> Demo -> Validate -> Closed/Won or Closed/Lost. From this dashboard view, we can see which opportunity stages showed up to this event. Pretty exciting to know that 12 opportunities touched this event and are now Closed/Won!

And, finally, check out that revenue and pipeline info! At Goldcast, our marketing team is goaled on pipeline and our sales team is goaled on revenue, so we're always trying to bring in as much pipeline as we can so that our sales team can be successful and close the deal.
💰Fill That Pipeline: Your Account-Based Marketing Playbook: 4 Events To Drive Pipeline and Revenue
Discover how to effectively prove the ROI of events and webinars
Learning how to prove event ROI is just one piece of the puzzle. To truly achieve overall event success, you need to also know how to put your digital event engagement data to work, as well as how to follow up after an event.
Luckily for you, we’ve laid all that out in the rest of our Event ROI Bootcamp series. Check it out now!

Event ROI Frequently Asked Questions (FAQs)
Q: How much in-house Salesforce support do we need to integrate the Event ROI Dashboard?
A: You'll need a Salesforce admin to install the package. Once that's set up, you can sync your historical data, allowing you to gain insights into all of the events you've done so far with Goldcast. No further Salesforce support needed!
Q: What is the best way to share a filtered report from the Event ROI Dashboard?
A: You've got options! You can download the report in various formats, including csv. However, if you're just looking to share in a visually appealing way, screenshotting it is a great way to go.
Q: How soon after an event will data be ready in the dashboard?
A: The dashboard reports are built in real time, which means that you can always access up-to-date metrics. The only exception here is "time spent"—you'll have to wait two hours after an event concludes before accurate numbers are available.
Q: Can you clarify influenced vs. sourced?
A: Sourced is basically going to tell you if an event got someone interested enough to become an opportunity. In these instances, the event happens before the opportunity is created. Influenced, on the other hand, refers to active opportunities that choose to register for or attend an event.
Where you focus your efforts will depend on your goals. If your objective is to bring in net-new contacts, you'll be looking at Sourced. However, if you're running a mid-funnel program where you want to bring in existing pipeline and customers, you'll be more concerned with Influenced. And, if your event is full-funnel, you'll look at both.
Transform Your Video Marketing with AI
Stay In Touch
Platform
Resources
© 2025 Copyright Goldcast, Inc. All rights reserved.




 Upcoming Events
 Event Series
 On-Demand Events